Finally! Historical Market Capitalization and more
New features and metrics available on IntoTheBlock Analytics
We’re happy to release a valuable update to IntoTheBlock Analytics. We’ve improved several indicators and metrics including historical correlation, historical market cap, circulating supply and many more!
There are 6 main improvements to our blockchain analytics platform that will help you get additional insights and guide your trading decisions. Let’s go through each of them.
Historical Market Cap
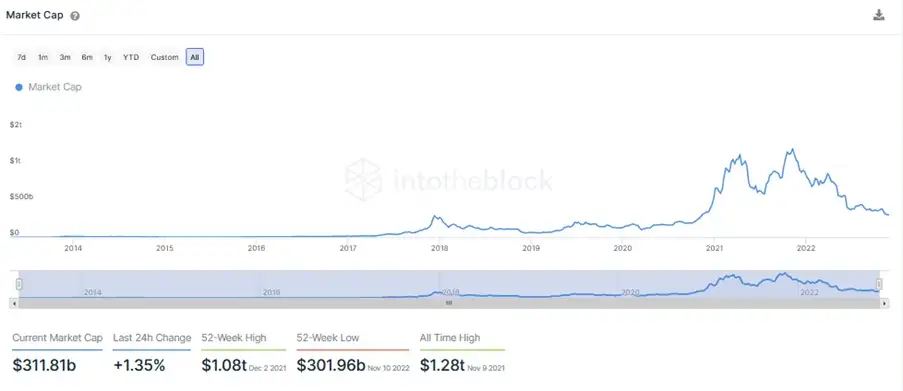
We now provide the daily market capitalization from the beginning of each asset. Market capitalization is the total dollar value of all the coins that are in circulation. This is an important metric because it helps you assess the value of a crypto asset with the circulating supply in mind.
Circulating Supply
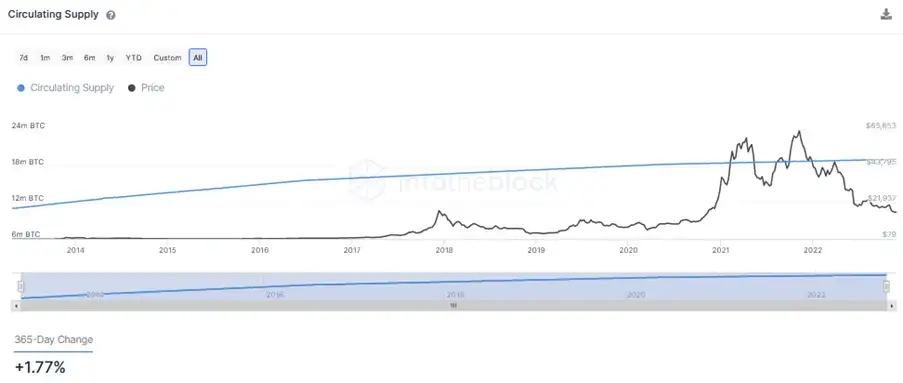
We now provide the daily circulating supply from the beginning of each asset as well. This refers to the number of cryptocurrency coins or tokens that are publicly available and circulating in the market.
Correlation Matrix & historical correlation
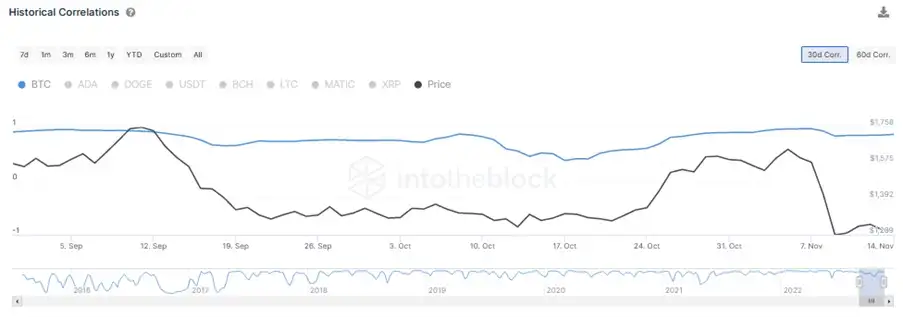
We now provide a correlation analysis between any crypto asset and the top 10 assets ordered by Market Cap, instead of only the correlation to BTC. The time frames we support are 30 days and 60 days.
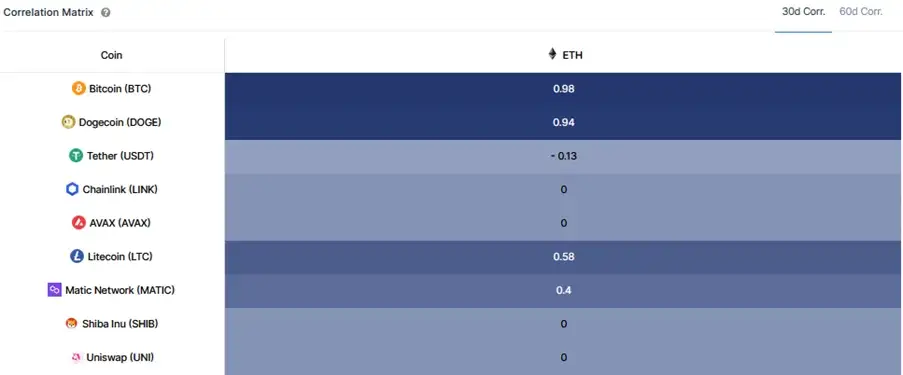
With these new metrics, you will also be able to analyze the historical correlations per asset.
Time held of coins transacted
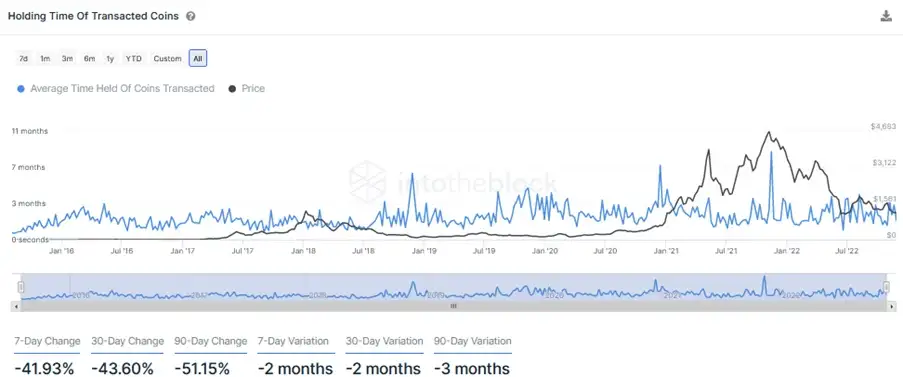
With this new release we provide insights into how long coins are held before they are transacted. This chart includes price and volume of transacted coins. This can be useful to analyze because it helps to understand the behavior of holders of a specific asset and potential selling pressure.
Holdings Distribution Matrix
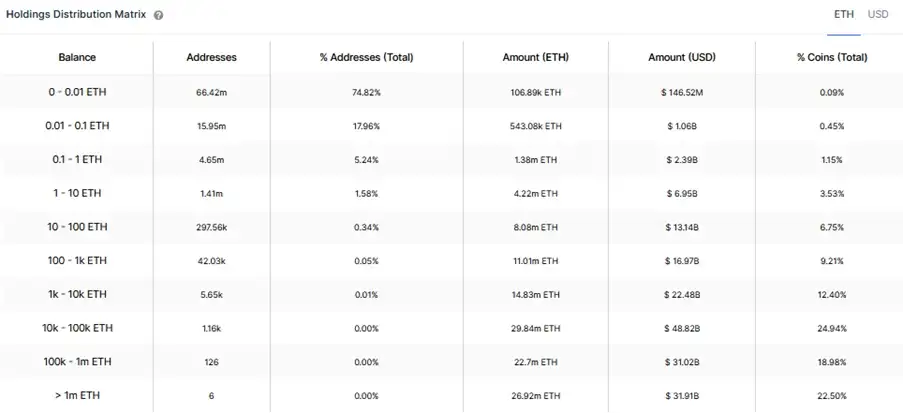
Last but not least, we now provide a simple breakdown of the number of addresses and volume held by different levels of holdings in our crypto Holdings Distribution Matrix. This table makes it easier to view how assets are distributed in the market.
Whilst this release brings a lot of exciting new metrics to our Analytics platform, we have plenty of things coming in the near future, including new assets and more features. Sign up for a free trial and click here to try out all the improved cryptocurrency analytics
