
Bitcoin and Ethereum’s 30-day realized volatility has been falling sharply during a period in time where the S&P 500’s realized volatility is trending upwards. The increased volatility in equities is likely attributed to high-interest rates, an appreciating dollar, and companies reporting poor quarterly earnings. The divergence in volatility could signal a potential decoupling between crypto and equities. Since peaking in early July, Bitcoin and Ethereum’s realized volatility has declined 67% and 63%, respectively.
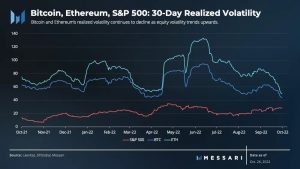
On the other hand, crypto finally broke out from its low volatility, with strong rallies across the market. As we’ll discuss, this contrasts the crash several tech stocks experienced following the release of their Q3 earnings reports.
Does this mean crypto is no longer correlated to stocks? This week we dive into data to answer this question, while also looking at on-chain data for Ethereum, potentially explaining its strong price performance.
This Week’s Key Metrics

Bitcoin BTC
Price
$20,250 (+6.3%)
Total Fees
$1.84M (+2.2%)
Exchange Flows
-$1.27B (-$1.1B)
![]()
Ethereum ETH
Price
$1,500 (+17.2%)
Total Fees
$26.2M (+11.0%)
Exchange Flows
-$65M (-$13M)
Fees – Sum of total fees spent to use a particular blockchain. This tracks the willingness to spend and demand to use Bitcoin or Ether.
- Bitcoin and Ethereum fees climbed as price action broke out to the upside
- In BTC and ETH terms, though, fees were lower than last week
Exchanges Netflows – The net amount of inflows minus outflows of a specific crypto-asset going in/out of centralized exchanges. Crypto going into exchanges may signal selling pressure, while withdrawals potentially point to accumulation.
- Bitcoin recorded its largest daily net outflow from centralized exchanges on Wednesday when over $1.5B was withdrawn
Ether saw modest outflows regardless of the strong price action
Crypto Outperforming Stocks
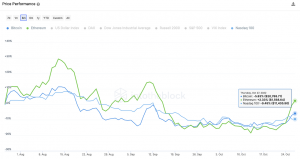
Bitcoin and Ether have performed better than stock indices over the past three months
- Despite rate hikes and geopolitical uncertainty, Bitcoin and Ether have held up better than the Nasdaq100
- Year-to-date, BTC’s -56% and ETH’s -59% are significantly better than the performance of tech stocks such as Meta’s -71% or Snap’s -80%
The strong performance as of late has resurfaced questions about crypto’s correlation to stocks.

Rebound From Yearly Lows
The correlation between Bitcoin and stock indices reached its lowest level in 2022 in mid October but has since climbed
- As earnings season began in mid October, the trend between stocks and crypto became stronger
- Correlation coefficient had reached a level of 0 for the first time since the first week of January prior to earnings, suggesting no statistical relationship between the two values
Economic results and projections from large companies had a toll on crypto’s performance, though perhaps not as much as some would have expected.
Stocks Crash, Crypto Climbs
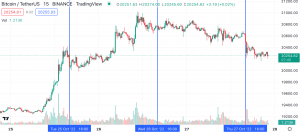
Crypto kicked off the week with a strong rally and remains higher despite subpar big tech earnings
- Bitcoin and Ether’s sharpe ratio over the past 30 and 90 days is higher than the tech ETF QQQ, suggesting crypto has been a better risk-adjusted return as per ITB data
- Intra-day, however, Google and Amazon’s negative results dragged down Bitcoin a few percentage as shown by the first and third vertical lines in the chart above
- Meta’s results leading to a 25% decline in the stock seemed to have little impact on Bitcoin and Ether
Here ETH in particular has been leading crypto’s outperformance.
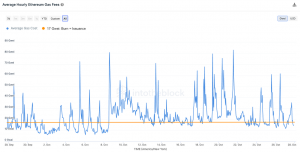
Ethereum Fees Spike
Increased network demand could be behind ETH’s outstanding 17% price increase
- Higher Ethereum fees means more ETH is spent to use the network
- Moreover, high demand for Ethereum also leads to decreasing ETH supply, as ETH becomes deflationary when fees are above 17 gwei (orange line above)
ETH’s supply increase since the merge has been of only 1.1k ETH, compared to the 509k ETH inflation that would have happened under the proof of work network, translating to an effective 99.78% decrease in net issuance